var operator = document.getElementById('operator').value;
https://internationalweather.yolasite.com/ <<< FOR WEATHER STORIES
BISHOPDALE WEATHER DATA
| BISHOPDALE | 2026 | August | days,, | Air | ||||||||||||||
| WIND | 1METRE | ..wind | ..wind | sun | SUN TEMPS | humidity | Pressure | Suns | .Heat | RAIN | ||||||||
| D | ...Night | ..DAY | direction | A.V.G 24 | UNDER | AM | .GUST | ..Run | PM | .SHINE | Grass | sun | min | .max | TODAY | input | .gain | |
| A | Air min | Air max | a.v.g | hour | ground | SKY | ..km/h | ...km | SKY | HOURS | min | .Max | A.V.G | to air | TODAY | FALL | ||
| T | Temp | temp | air temp | temp | % | % | Temp | |||||||||||
| MM | ||||||||||||||||||
| 1 | -3 | 9.4 | west | 3.20 | 9 | cloudy | 51 | 212 | sunny | 7 | 2.1 | 26 | 65 | 98 | 1017 | -4.20 | 7 | |
| 2 | -3.7 | 15.7 | north | 6.00 | 9 | sunny | 19 | 40 | sunny | 9 | -5.7 | 37.9 | 67 | 97 | 1018 | 39 | -1.40 | 0 |
| Bishopdale AND Opawa August 2026 | ||||||||
| CHRISTCHURCH N.Z | Bishopdale | Opawa | ||||||
| Coldest Night Temp in c | -3.7 | 0.00 | ||||||
| Warmest night Air Temp c | -3 | 0.00 | wid die | days | Days of | Days | Days | |
| Total night temps= | -6.7 | 0 | Bishopdale | Bishopdale | Temps | Bishopdale | Opawa | |
| Air A.V.G night temp c | -3.35 | #DIV/0! | ne | 0 | Days25c>c | 0 | 0 | |
| coldest max day air temp c | 9.4 | 0 | north | 1.00 | Days22c> | 0 | 0 | |
| Warmest Day air temp. c | 15.7 | 0 | nw | 0.00 | Days18c> | 0 | 0 | |
| Total day temps= | 25.1 | 0 | west | 1 | Days18c< | 2 | 0 | |
| Total night and day temp= | 18.4 | 494 | sw | 0 | Days13c< | 1 | 0 | |
| A.V.G max day air temp c | 12.55 | #DIV/0! | south | 0 | Days10c< | 1 | 0 | |
| TREND FOR MONTH>Min night temps | -5.45 | NA | se | 0 | Days5.1c< | 0 | 0 | |
| TREND FOR MONTH>Max day temps | -0.15 | NA | Total | 2 | ||||
| A.V.G MONTH TEMP | 4.60 | #DIV/0! | ||||||
| TREND FOR MONTH | -2.80 | NA | ||||||
| 1 Metre under ground avg temp c | 9.0 | NA | AVG SOLAR CYCLE25 | |||||
| Humidity Monthly A.v.g % | 81.8 | NA | SUNSPOT | |||||
| Hottest sun temp c | 37.9 | NA | LOW | NUMBER | YESTERDAY | |||
| Avg day sun temp.c | 31.95 | NA | AVG>> | 118.7 | 118.9 | |||
| A.V.G Sun input to air temps. | 39.0 | NA | LOW | HIGH | ||||
| Coldest Grass c | -5.7 | NA | 4/12/22 | 80.2 | 10/4 | 134.8 | ||
| Avg Grass night temp c | -1.80 | NA | ||||||
| Rainfall=mm | 7 | 0.0 | August | temps taken | with out | Radiation shield | ||
| Wind run KM Month= | 252.0 | 0 | avg night T | -1.80 | ||||
| highest wind gust km | 51 | 59.6 | Day | WARMEST> | 37.90 | |||
| Sunshine hours | 16 | NA | avg day= | 31.95 | ||||
| A.v.g air pressure | 1017.5 | #DIV/0! | Month | avg= | 15.08 | |||
| Air frosts | 2 | 0 | COLDEST | -5.7 | night | |||
| Number of East wind days | 0 | NA | Grass Frost= | 1 | ||||
| Number of Northeast Wind Days | 0 | na | ||||||
| Number of North wind days | 1 | NA | #N/A | |||||
| Number of Northwest wind days | 0 | NA | shade | |||||
| Number of west wind days | 1 | NA | August | metservice | ||||
| Number of Southwest wind days..... | 0 | NA | temp avg | 5.08 | ||||
| Number of South wind days | 0 | NA | day | 12.55 | ||||
| Number of Southeast wind days | 0 | NA | NIGHT | -2.40 | ||||
| Max A.VG air temp of a East Wind day | #DIV/0! | na | ||||||
| Max a.v.g air temp of a Northeast Wind day | #DIV/0! | NA | ||||||
| Max "A.VG air temp of a North Wind day | 15.70 | NA | ||||||
| Max A.VG air temp of a Northwest Wind day | #DIV/0! | NA | ||||||
| Max A.VG air temp of a West Wind day | 9.40 | NA | ||||||
| Max A.VG air temp of a SouthWest Wind day | #DIV/0! | NA | ||||||
| Max A.VG air temp of a South Wind day | #DIV/0! | NA | ||||||
| Max "A.VG air temp of a Southeast Wind | #DIV/0! | NA |
OPAWA AND metservice data for Christchurch.
Opawa CHCH | <p> | ||||||||||
| ..DAY | 2026 | ` | August | <p> | |||||||
| Air max | …WIND | Air | June | 2026 | |||||||
| ..Night | temp | speed | A.V.G 24 | Pressure | summary | metservice | |||||
| Air min | Air max | Max | hour | TODAY | Rainfall | wind | min night | day | |||
| Temp | temp | air temp | A.V.G | .in mm | run | temp | max | rain | |||
| 1 | #DIV/0! | -1.7 | 9.6 | 4.2 | |||||||
| 2 | #DIV/0! | -3.1 | 15.5 |
YEARS DATA SO FAR.
Web page data | ||||||||
| 0 | ||||||||
Air A.v.g Temp Sofar This Year. | 11.84 | |||||||
diif between night and day temps | 10.30 | |||||||
1mtr under AVG | 14.35 | |||||||
Day max air- a.v.g 1metre under temp (Months) | 2.20 | |||||||
THE SOLAR MAX AVG DAY TEMP & THE 1METRE UNDERGROUND MAX INDEX | 20.11 | |||||||
Dif Between avg air temp &1mtre under temp red air cooler | 2.51 | |||||||
Clear Sky Index Night | -7.57 | |||||||
clear Sky Index Day | 2.74 | |||||||
The avg max sun temp for year | 34.46 | |||||||
Suns input to Air temps | 49.14 | |||||||
SOLAR FLUX | 31.5 | |||||||
Solar Strength index | 2.04 | |||||||
| how | much | hotter | is the | SUN | 1.44 | |||
SUN AND AIR TEMP DIFFERENCE INDEX | 22.62 | |||||||
NEW SUN AND AIR TEMP DIFFERENCE INDEX | 37.30 | |||||||
| FOR AVG SUN | sum= | |||||||
| 365 | Total sun temp-total air temp-sunshine /total days | 5.7 | ||||||
NEW SUN TEMP | 83.60 | |||||||
SOLAR HEAT INDEX | 71.76 | |||||||
The Wind Strength Index | 81.20 | |||||||
A.V.G WIND RUN PER DAY THIS YEAR | 150.12 | |||||||
avg day time humidity % | 57.4 | |||||||
AVG of all data | 1207 | |||||||
Nice Day Index | 259 | |||||||
WINDRUN AND SUN INDEX | 4.4 | |||||||
years avg wind run / by years avg temp index | 12.68 | |||||||
years avg sun temp - years avg temp - avg years 1meter under temp | 8.27 |
| UPDATED each Saturday week | 31 |
| BISHOPDALE ONLY | |
| YEARLY WEATHER SUMMARY 2024 | 2026 |
| SO FAR | |
| AVG number of Air frosts in a year | 40 |
| Number of frosts sofar this year | 23 |
| 1994-2023 A.v.g air temp is>> | 11.95 |
| Air A.v.g Temp Sofar This Year. | 11.84 |
| TREND IN AVG AIR TEMP FOR YEAR= | -0.11 |
| Warmest Night Temp Sofar This Year | 17.8 |
| COLDEST Night Temp SOFAR THIS YEAR | -6.4 |
| WARMEST DAY Temp SOFAR THIS YEAR | 31.8 |
| COLDEST DAY TEMP SOFAR THIS YEAR | 7.0 |
| A.V.G DAY TIME AIR TEMPS THIS YEAR | 17.09 |
| A.V.G NIGHTTIME AIR TEMPS THIS YEAR | 6.78 |
THIS YEARS SUN TEMPS AND INDEXS | |
| Total Sunshine hours this year | 1,086.00 |
| HIGHEST DAILY SUNSHINE HOURS YEAR | 12 |
| LOWEST DAiLY SUNSHINE HOURS YEAR | 0 |
| A.V.G SUNSHINE HOURS PER DAY For year sofar | 5.2 |
| HIGHEST SUN TEMP FOR YEAR | 59 |
| LOWEST SUN TEMP FOR YEAR | 9.8 |
| AVG SUN TEMP FOR YEAR | 34.46 |
| LOWEST GRASS TEMP FOR YEAR | -8.9 |
| NEW SUN AND AIR TEMP DIFFERENCE INDEX | 37.30 |
| New sun&1metre under ground index | 5.8 |
| NEW SUN TEMP | 83.60 |
| SOLAR HEAT INDEX | 71.76 |
| SUN AND AIR TEMP DIFFERENCE INDEX | 22.62 |
| Solar Strength index | 2.04 |
| Suns input to Air temps | 49.14 |
| clear Sky Index Day | 2.74 |
| Clear Sky Index Night | -7.57 |
1 METRE UNDER TEMPS AND INDEXS | |
| WARMEST 1MTRE UNDER GROUND temp this year | 16.6 |
| COLDEST 1MTRE UNDER GROUND temp this year | 9.1 |
| A.V.G 1MTRE UNDER GROUND TEMP THIS YEAR> | 14.35 |
| If black air is warmer than 1metre under groud temp | -2.51 |
| WIND DATA | |
| Daily Highest wind speed this YEAR= km/h | 92.9 |
| Daily Lowest wind speed this YEAR= km/h | 7 |
| DAILY A.V.G WIND SPEED SOFAR THIS YEAR>>>> | 38.81 |
| Daily Highest wind RUN this YEAR= km/h | 448 |
| LOWEST DAILY WIND RUN THIS YEAR>>>>>km | 7 |
| A.V.G WIND RUN PER DAY THIS YEAR>>>>>km | 150.12 |
| TOTAL WIND RUN THIS YEAR SOFAR>>>>>km | 30024.2 |
| The Wind Strength Index | 81.20 |
| AIR-PRESSURE AND INDEXS | |
| HIGHEST AIR PRESSURE THIS Year SOFAR A.V.G | 1040 |
| LOWEST AIR PRESSURE THIS Year daily A.V.G | 984 |
| A.V.G AIRPRESSUR THIS Year SOFAR>>>>>>>>>>> | 1012.00 |
| AIRPRESSURE RAIN INDEX ( - means more rain) | -1.00 |
| YEARS RAINFALL | |
| TOTAL RAINFALL THIS YEAR SOFAR IN MM | 329.8 |
| NORMAL RAINFALL FOR BISHOPDALE CHCH | 630 |
| How much more rain do we need to get to avg -=how much short we are | 300.2 |
| THE SOLAR MAX AVG DAY TEMP & THE 1METRE UNDERGROUND MAX INDEX | 20.11 |
| 1mtr under AVG year | 14.35 |
| The avg max sun temp for year | 34.46 |
| Normal avg sun temp avg for this time of year | 33.02 |
| sun temp avg diff | 1.44 |
| Dif Between avg air temp &1mtre under temp red air cooler | 2.51 |
| avg day time humidity % | 57.4 |
| Nice Day Index | 80.67 |
| Total of all data> | 37421.7 |
| Day max air- a.v.g 1metre under temp (Months) | 2.20 |
| dev by number data>> | 31 |
| Nice Day Index | 259 |
| AVG of all data | 1207 |
| Total sun temp-total air temp-sunshine /total days | 5.7 |
| WINDRUN AND SUN INDEX | 4.4 |
| SOLAR FLUX | 31.5 |
| diif between night and day temps | 10.30 |
| TOTAL GRASS FROSTS THIS YEAR | 48 |
| SUN.AIR.GROUND FLUX========== | 20.11 |
...............................................1994-2023 avg...............................................
1994-2023 A.V.G......
| Month | A.v.g | A.v.g | A.v.g | Air coldest night Temp | Air warmest night Temp | AIR coldest day Temp | Air warmest dayTemp | AVG | WIND | Grass coldest Temp | Sun warmest temp in sunlight | A.v.g humidity% | A.v.g sunshine hours |
| air night | air day | Months | RAIN FALL | RUN IN | |||||||||
| Temp | Temp | air Temp | KM | ||||||||||
| January | 11.9 | 23.2 | 17.55c 19.54c-2018 | 2.6 | 21.4 | 11.4 | 37.2 | 49 | 6587 | -0.1 | 60.1...............2018 | 66% | 225 |
| Year | 2013 | ||||||||||||
| February | 11.7 | 22.65 | 17.17 | 1.2 | 21.5 2019 | 11.7 2022 | 41.5 | 53 | 5273 | 0 | 56.82014 | 69% | 203 |
| Year | 1973 | ||||||||||||
| March | 10.1 | 20.5 | 15.3 | 0.6 | 18.15 IN 2024 | 11.7 | 35 | 55 | 5224 | -1.4 | 54.6c | 74% | 178 |
| April | 6.8 | 17.48 | 12.16 | -4 | 17.3 2024 | 8.2 | 30.3 | 87 | 3916 | -5.1 | 50.9 | 74% | 134 |
| 1994 | |||||||||||||
| May | 4.3 warmest avg 6.43c 2023 | 14.5 | 9.4 | -5.5 | 15c 2023 | 4.2 | 28.7 | 55 | 3922 | -9.8 | 41.9 | 73% | 130 |
| Year | 2015 | 2015 | |||||||||||
| June | 1.7 wamest avg4.53c 2023 | 11.4 | 6.55 | -6 | 11.9 2023 | 3.3 | 21.4 | 60 | 2518 | -9.6 | 34.3 | 75% | 89 |
| Year | 1993 | 2012 | 2014 | ||||||||||
| July | 0.9 | 11 | 5.95 | -6 | 10.2 | 3.1 | 21.1 | 60 | 3288 | -10.2 | 38.6 | 73% | 110 |
| Year | 2007 warmest coldest -2.4c 2023 | 2014 | 2011 | 2014 | 2014 | ||||||||
| August | 2.1 | 12.7 | 7.4 | -5 | 11.6 | 3.3 | 23.3 | 59 | 3806 | -8.6 warmest coldest. -2.9c 2023 | 41.4 | 77.50% | 126 |
| 1995 | |||||||||||||
| September | 3.7 | 15.4 | 9.57 | -4.2 | 15.3c 2023 | 0.8 | 29.6 | 40.4 | 4686 | -7.4 | 43.9 | 73.60% | 164 |
| 2007 | |||||||||||||
| October | 6.0 | 17.8 | 11.9 | -3 | 16.3 1991 | 6.3 | 30.5 | 60 | 5588 | -6.2 | 49.6 | 70.80% | 197 |
| 1990 | |||||||||||||
| November | 8.2 | 19.73 | 14 | -1.8 | 18.9 2019 | 9.8 | 36 | 49 | 6070 | -4 | 57.9c 2019 | 66% | 224 |
| 2015 | |||||||||||||
| December | 11 | 22 | 16.5 | 2.4 | 20 | 9 | 35.5 | 51 | 6277 | 0.5 | 56.1 | 69% | 240 |
| Year=11.96c | 2013 | ||||||||||||
...................................................................NEWS...................................................................................................
17/01/13
A magnitude-3.3earthquake that struck Christchurch this afternoon could be the 11,000th tremor since September 4, 2010.
17/01/13
A magnitude-3.3earthquake that struck Christchurch this afternoon could be the 11,000th tremor since September 4, 2010.
The quake hit at 12.55pm, 15 kilometers east of Christchurch at a depth of 6km. Over 163 people reported feeling the
“moderate” shake on the GeoNet website.
23rd Dec 2011>>String of aftershocks hit Christchurch
23rd Dec 2011>>String of aftershocks hit Christchurch
http://www.stuff.co.nz/the-press/news/christchurch-earthquake-2011/8190585/11-000-quakes-since-Sept-2010torm
http://www.3news.co.nz/String-of-aftershocks-hit-Christchurch/tabid/423/articleID/237582/Default.aspx
15/06/11>> http://www.stuff.co.nz/national/christchurch-earthquake/5145114/Mondays-earthquakes-lift-risk-to-30pc"
We know the plate boundary faults' history and behaviour that, say, every 300 years they do this or that. But with this
type of event, we don't know what is normal for the Canterbury region," Furlong said. "We assumed what we had up to
September 4 was normal, but it appears it wasn't normal. We don't know what is the background condition that the Earth
is now moving towards. "Each earthquake sequence is unusual, this one both because of its character and observation.
"It's as well-recorded as any of this size has ever been. We are seeing things about it – things that we don't see in any
other place. "It's aspects of this that makes this [sequence] very important to science and why it's hard to be definite
about how it's going to behave." 13/06/11>>At least six people are injured and there have been reports of building
collapses in Christchurch, after two major earthquakes struck this afternoon in a city that is trying to recover from
major quakes in September and February
Full list of those killed in the Christchurch quake>>
http://nz.news.yahoo.com/a/-/top-stories/9033845/full-list-of-those-killed-in-the-christchurch-quake/23/02/11>Death toll at 103, expected to rise>>http://nz.news.yahoo.com/a/-/top-stories/8903402/death-toll-at-102-expected-to-rise/ 22/02/11>65 dead
http://nz.news.yahoo.com/a/-/top-stories/8882957/police-expect-multiple-fatalities/22/02/11>Parker: Life as we know
it has come to an end.http://nz.news.yahoo.com/a/-/top-stories/8883778/parker-life-as-we-know-it-has-come-to-an-end/
06/02/11> Timaru swelters in record heathttp://nz.news.yahoo.com/a/-/top-stories/8784904/timaru-swelters-in-record-heat/
24/11/10>29 deadThe 29 killed in the Pike River Coal mine disaster14/11/10> a 4.7 after shock last night. We up to 3000
after shocks now.
12/11/10> Its Canterburys birthday.
09/10/10> The 1mtre underground Temp reading for this week is the highest recorded may be because of the earthquakes and
air temp have been normal.
05/09/10>Christchurch recovers after horror quakeclick for pics
04/09/10>>The powerful 7.1-magnitude earthquake that smashed buildings, cracked roads and twisted rail lines around the
New Zealand
city of Christchurch on Saturday also ripped a new 11-foot wide fault line in the earth's surface, officials said Sunday.http://www.msnbc.msn.com/id/39002792/ns/world_news-asia-pacific/
|
|
|
|
|
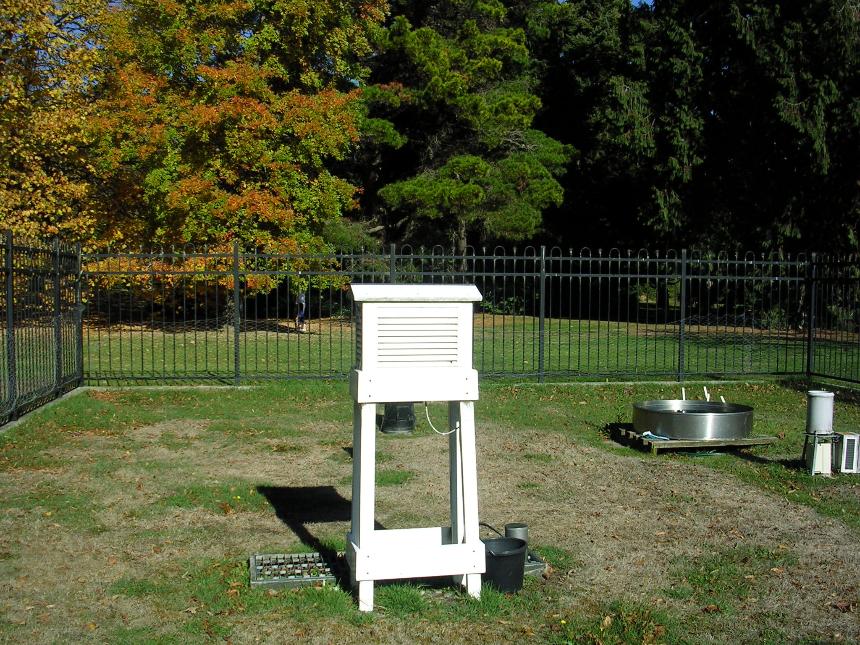
NIWA Christchurch Gardens Weather Station
|
|
|
|
|
Click the button to see the counter increase.
Close the browser tab (or window), and try again, and the counter will continue to count (is not reset).